To comply with my non-disclosure agreement, I have omitted and obfuscated confidential information in this case study. All information in this case study is my own and does not necessarily reflect the views of Resolver.
The Challenge
Our goal for the project was to equip users with the tools to work across multiple data points at once, perform bulk actions, and obtain a bird’s eye view into how risks and incidents across their company are trending. Our ambitions were to create a strong foundation that embraced our ever-evolving diverse customer base.
Our High Level Goals were to:
1. Save users time from switching between multiple forms to perform an assortment of updates and actions.
2. Give users more control over their company’s data and how it can be manipulated.
3. Create a tool that enables deeper company insight.
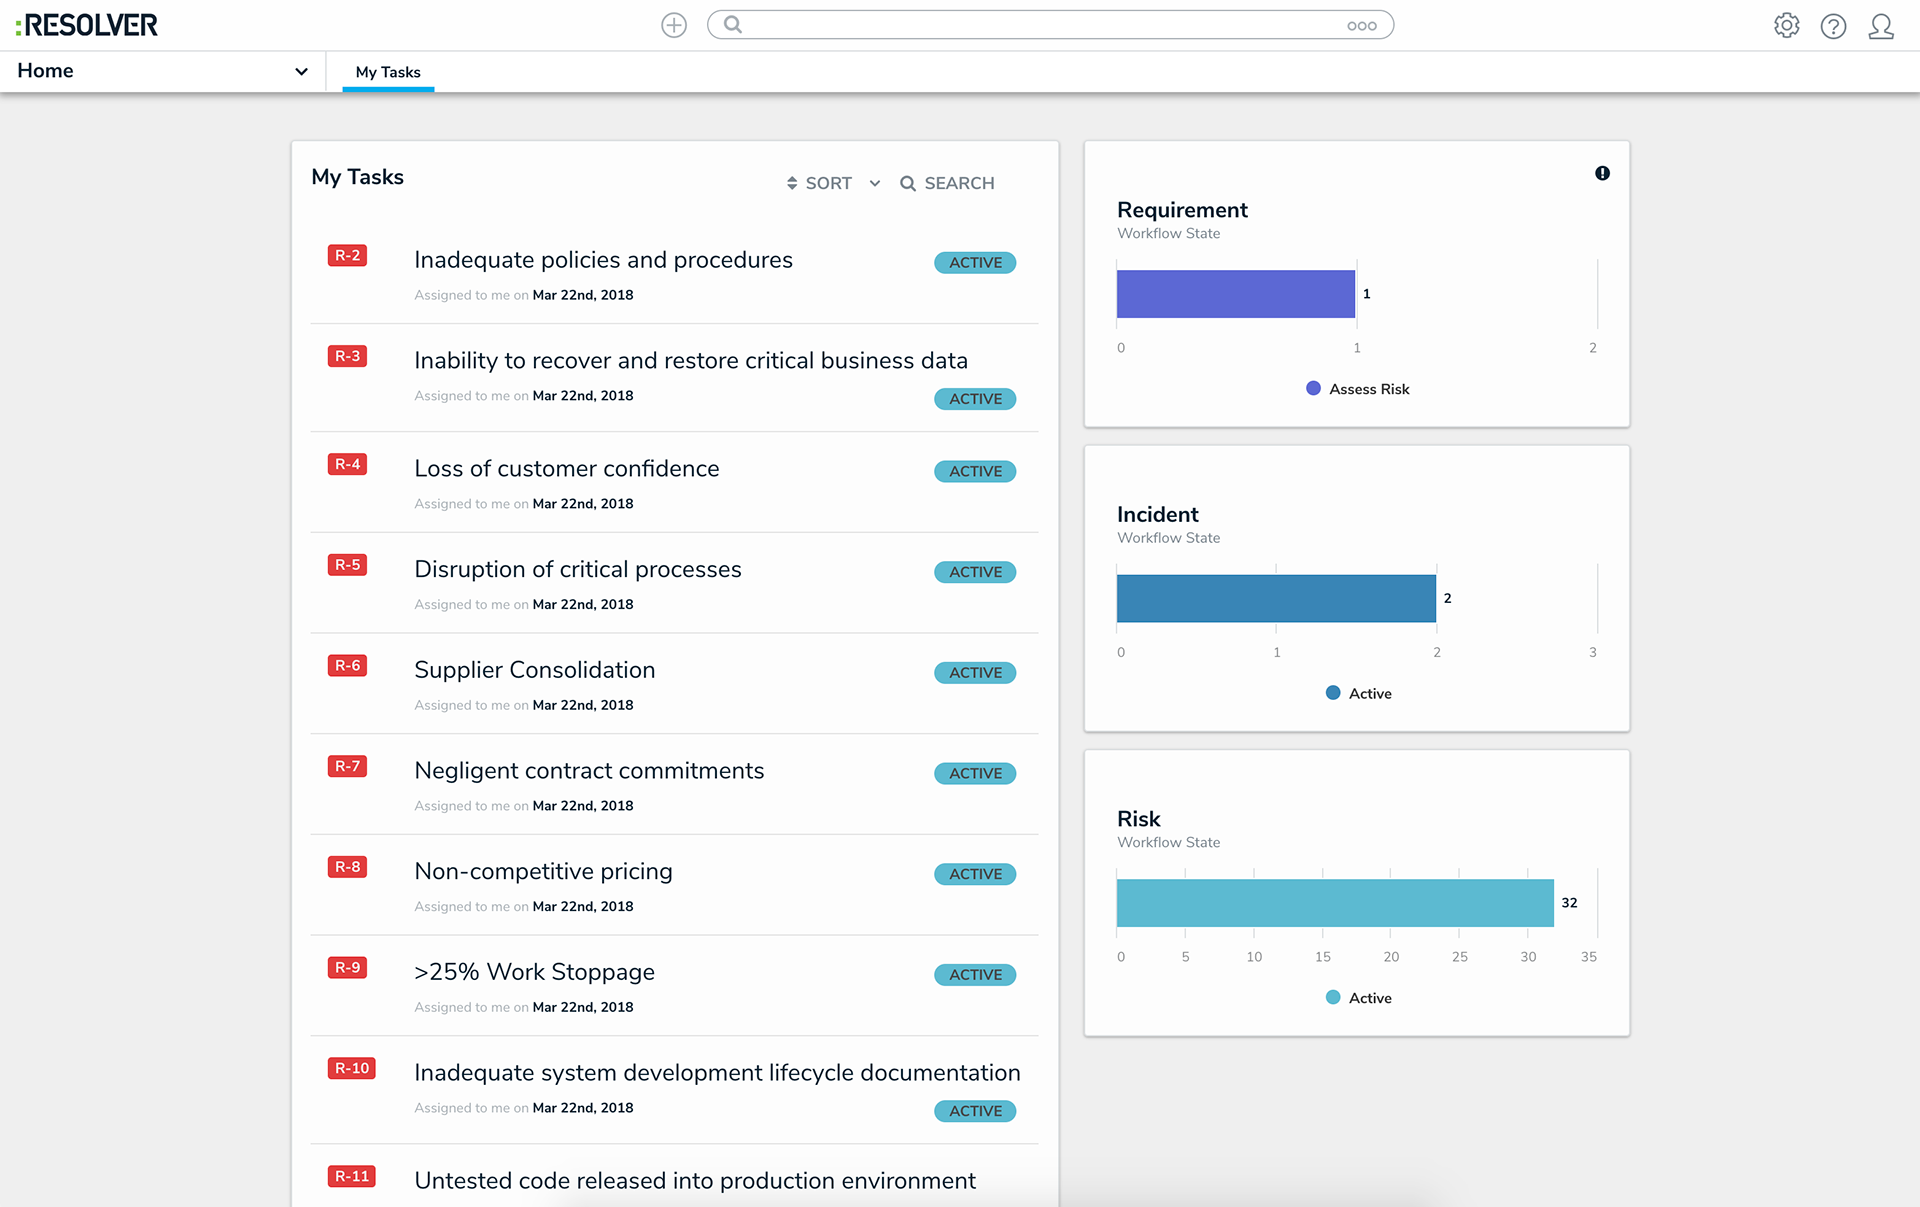
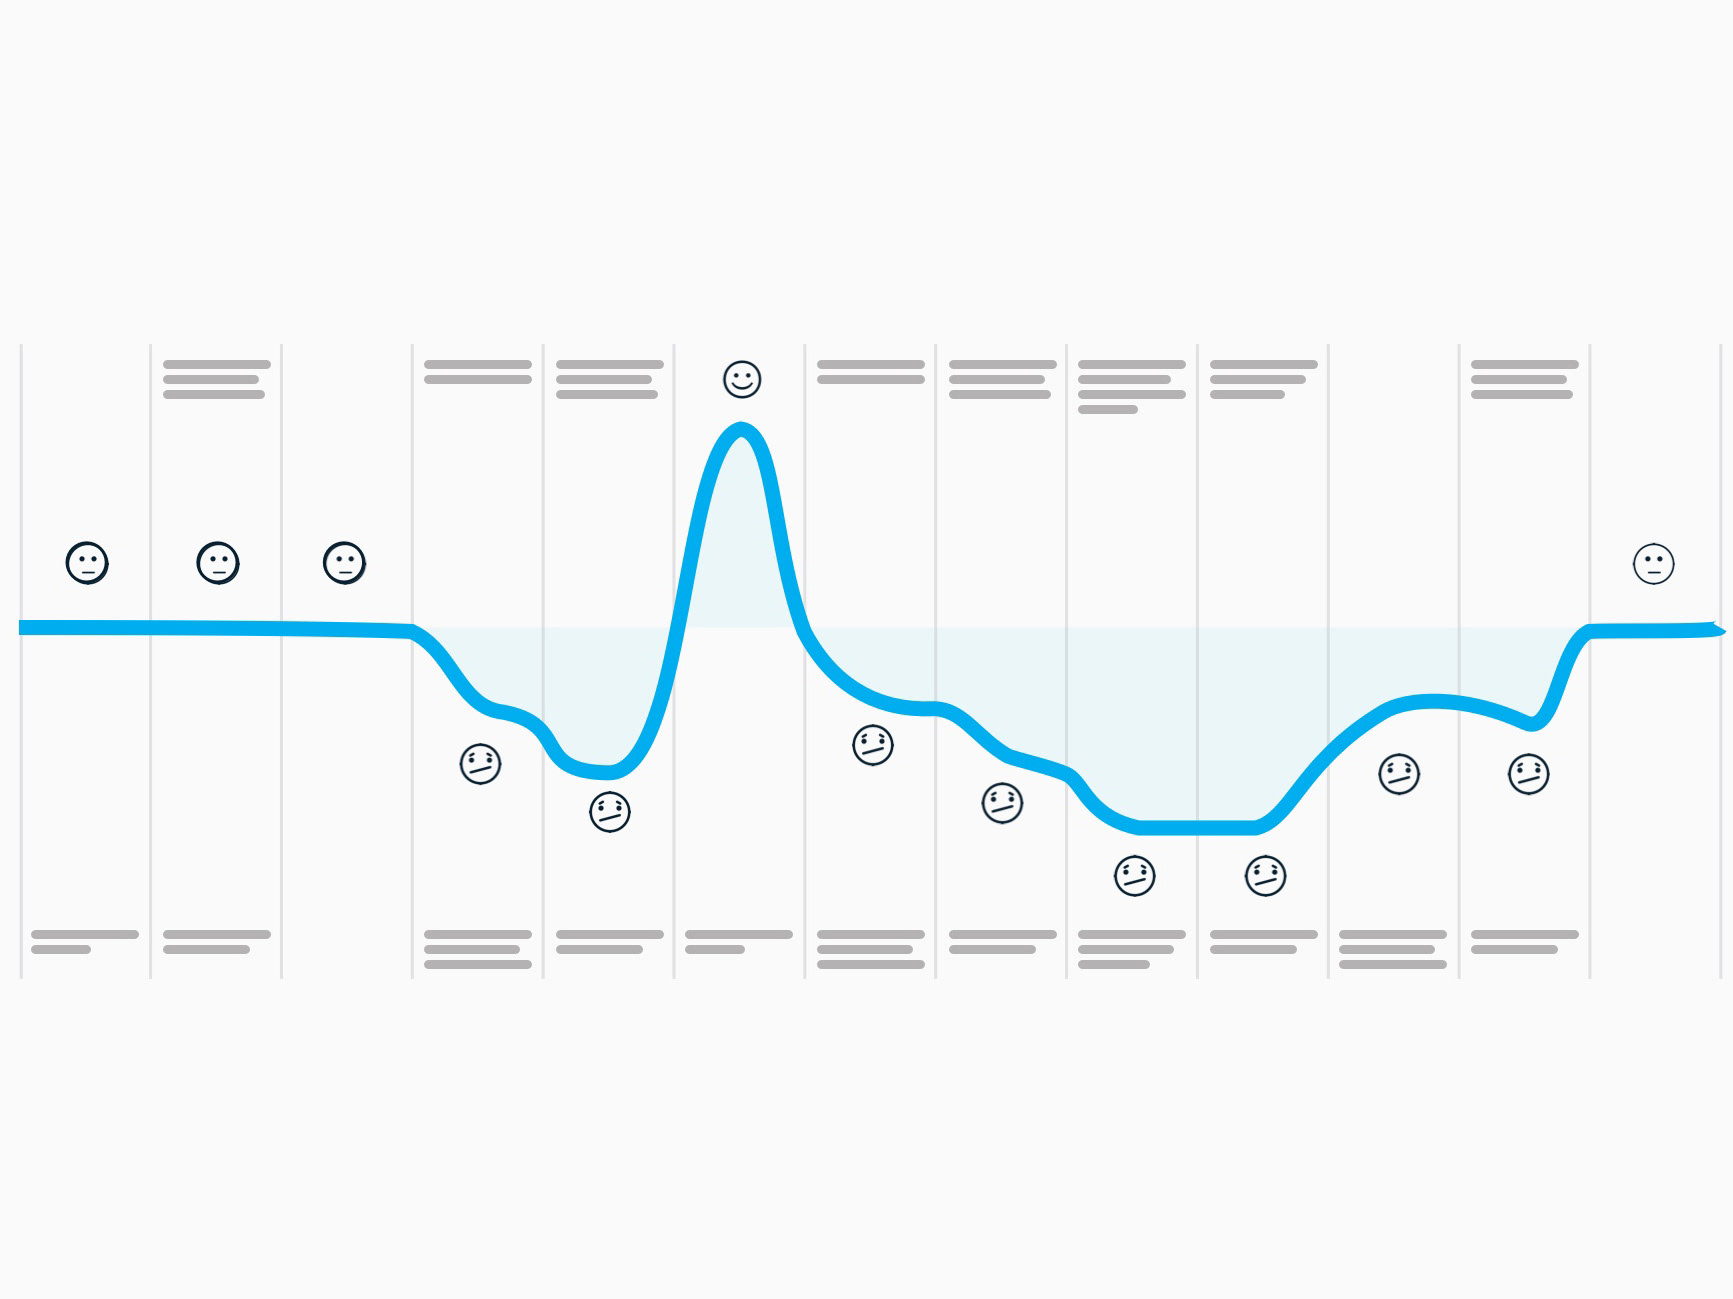
'My Tasks' depicting multiple forms that a user may have to switch between to update
My Role:
I worked alongside another designer for the feature’s initial design implementation, after which time I led the user research and design iteration efforts.
In addition, I worked alongside 2 Product Managers and a team of developers during its build phase.
User Research
At the outset of the project we didn’t have a clear understanding of the variety of ways that users wanted to manipulate data stored in Resolver. However, we were aware that they were currently exporting data from Resolver into Excel for further manipulation. Therefore we kicked off our research by chatting with users to understand how they were using Excel (and other tools that they named) to work with data that was exported from Resolver.
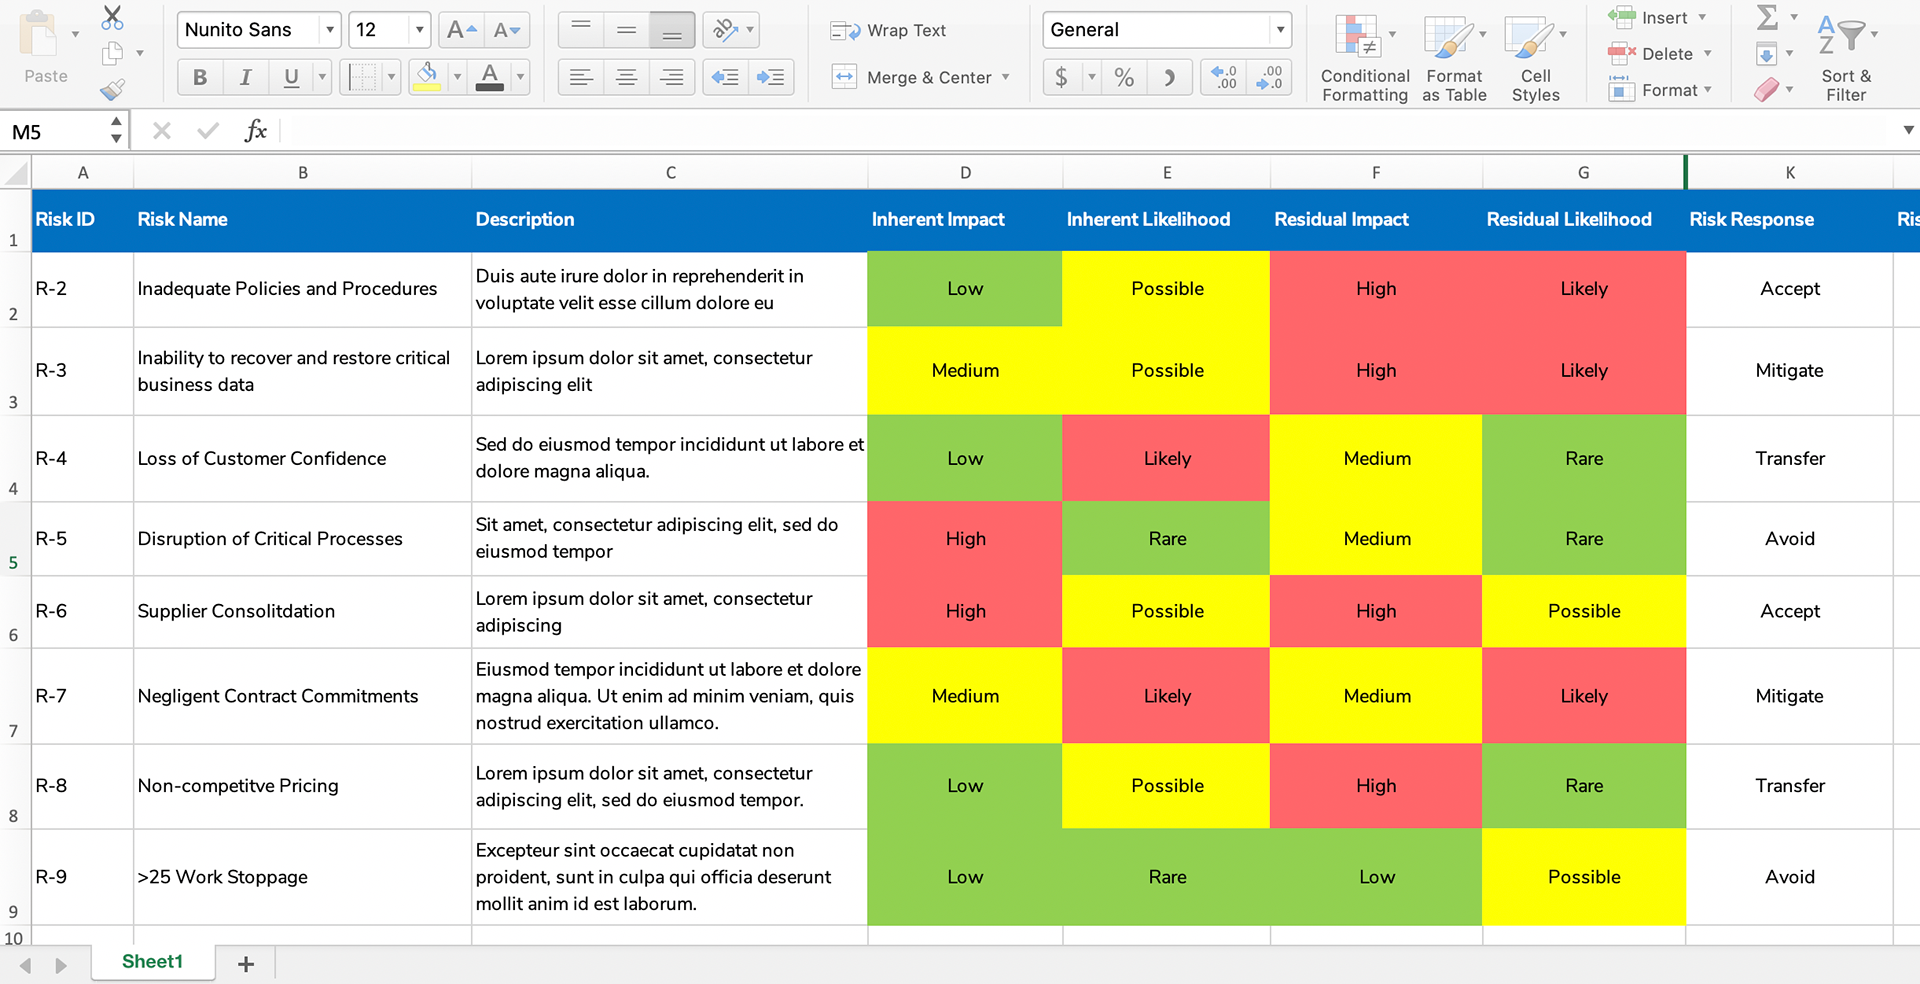
Sample data (from several forms) depicted in Excel
Insights from Research
The largest action performed on exported data in Excel was the use of filtering.
Other actions performed were:
- The identification of trends;
- Ability to make bulk edits and updates; and
- The ability to create graphical reports to present to the company’s board of directors.
Working backwards from perfect
From our research, three key design challenges emerged:
- How might we better enable the user to filter across large swaths of sometimes divergent data?
- How might we surface trends across the business?
- How might we better adapt to the dynamic nature and difference between our risk and security customers.
Success Criteria
The largest metric of our success for this feature would be the steady decline in the percentage of exports to Excel. It would infer that the quality of data manipulation offered in Resolver is meeting our customers’ needs.
The Design Solution
Design completed in collaboration with Tim Chisholm
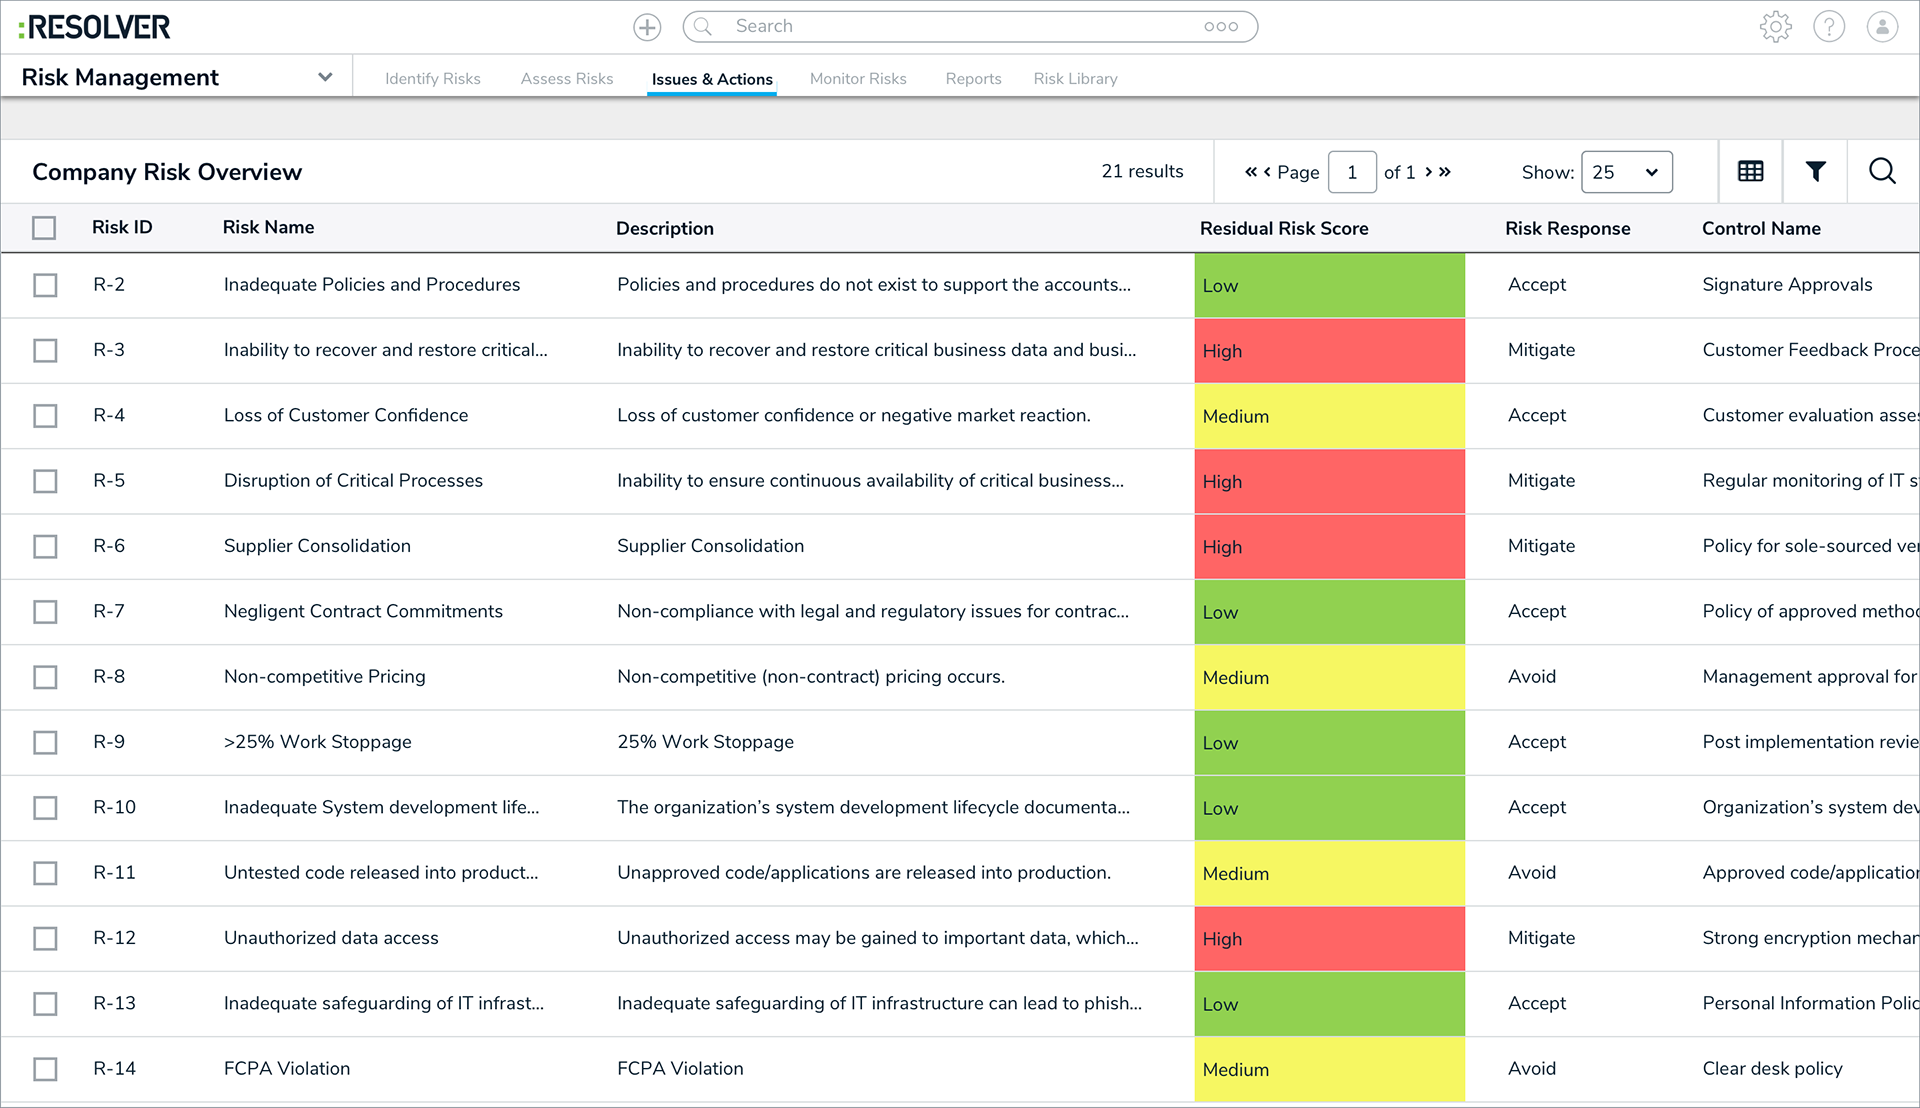
Resolver's DataGrid offers a standard set of controls which enables users to manipulate data in all the ways that matter to them most, without any unnecessary bloat.
Users have the ability to:
- Toggle columns on and off as they need;
- Set text to overflow or wrap;
- Switch between colored cells and colored ovals;
- Invoke a filter bar to filter specifically by column;
- Edit text directly in the table and make changes through dropdown lists; and
- Search
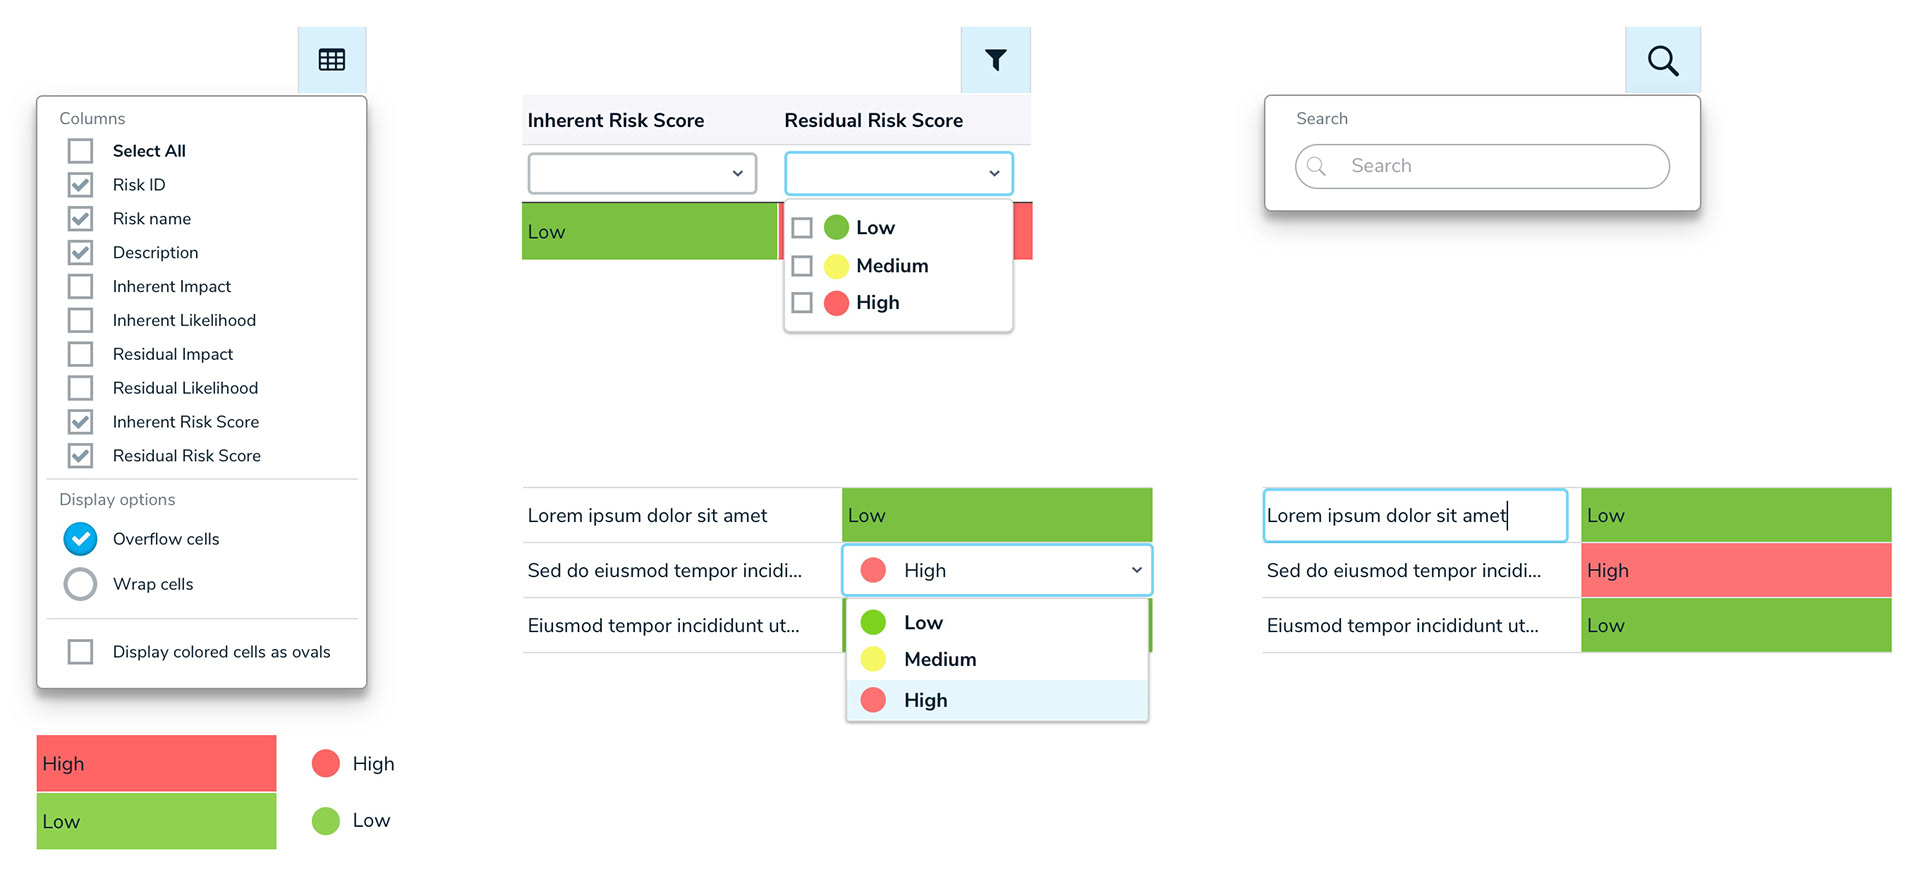
Various controls available as part of the DataGrid
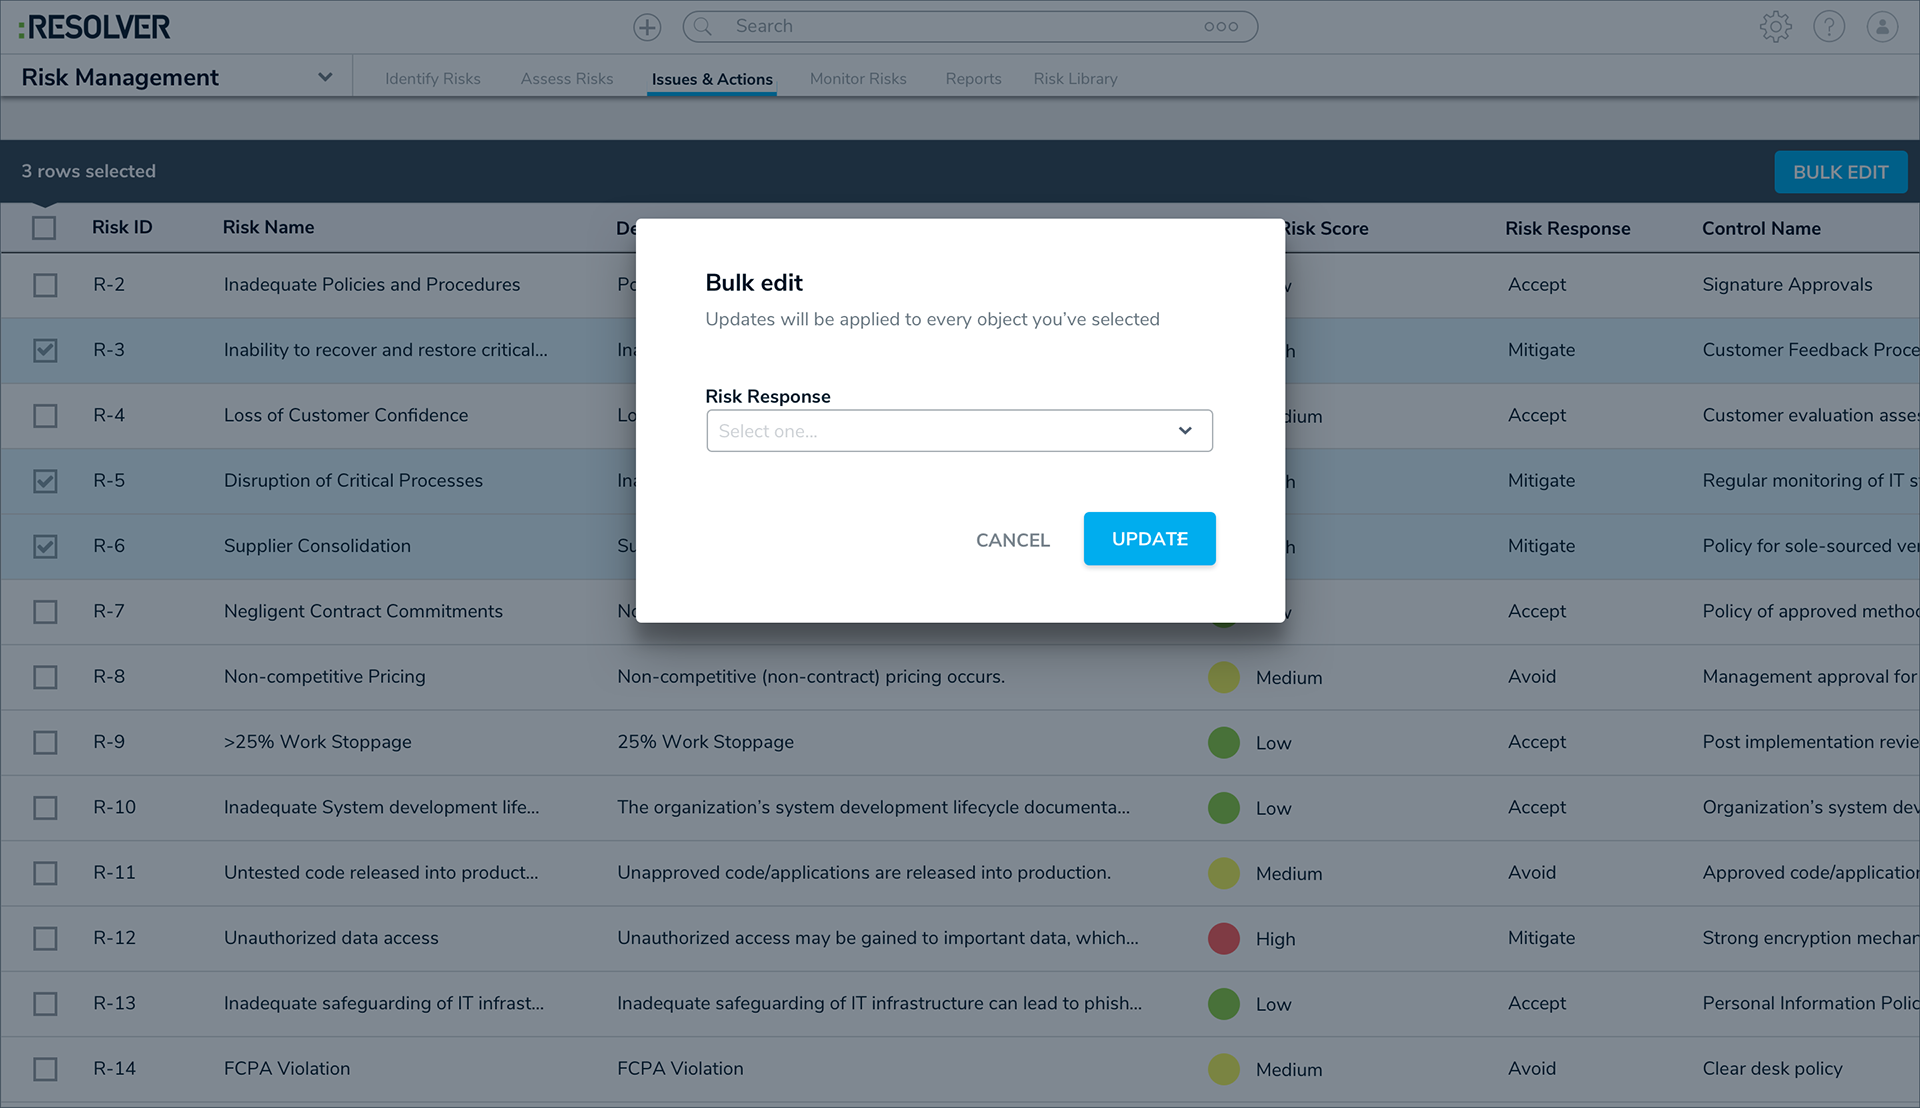
The user has the ability to perform bulk edits on the data within the grid.
The user also has the ability to get more detailed information such as a trending analysis by invoking the grid's side panel.
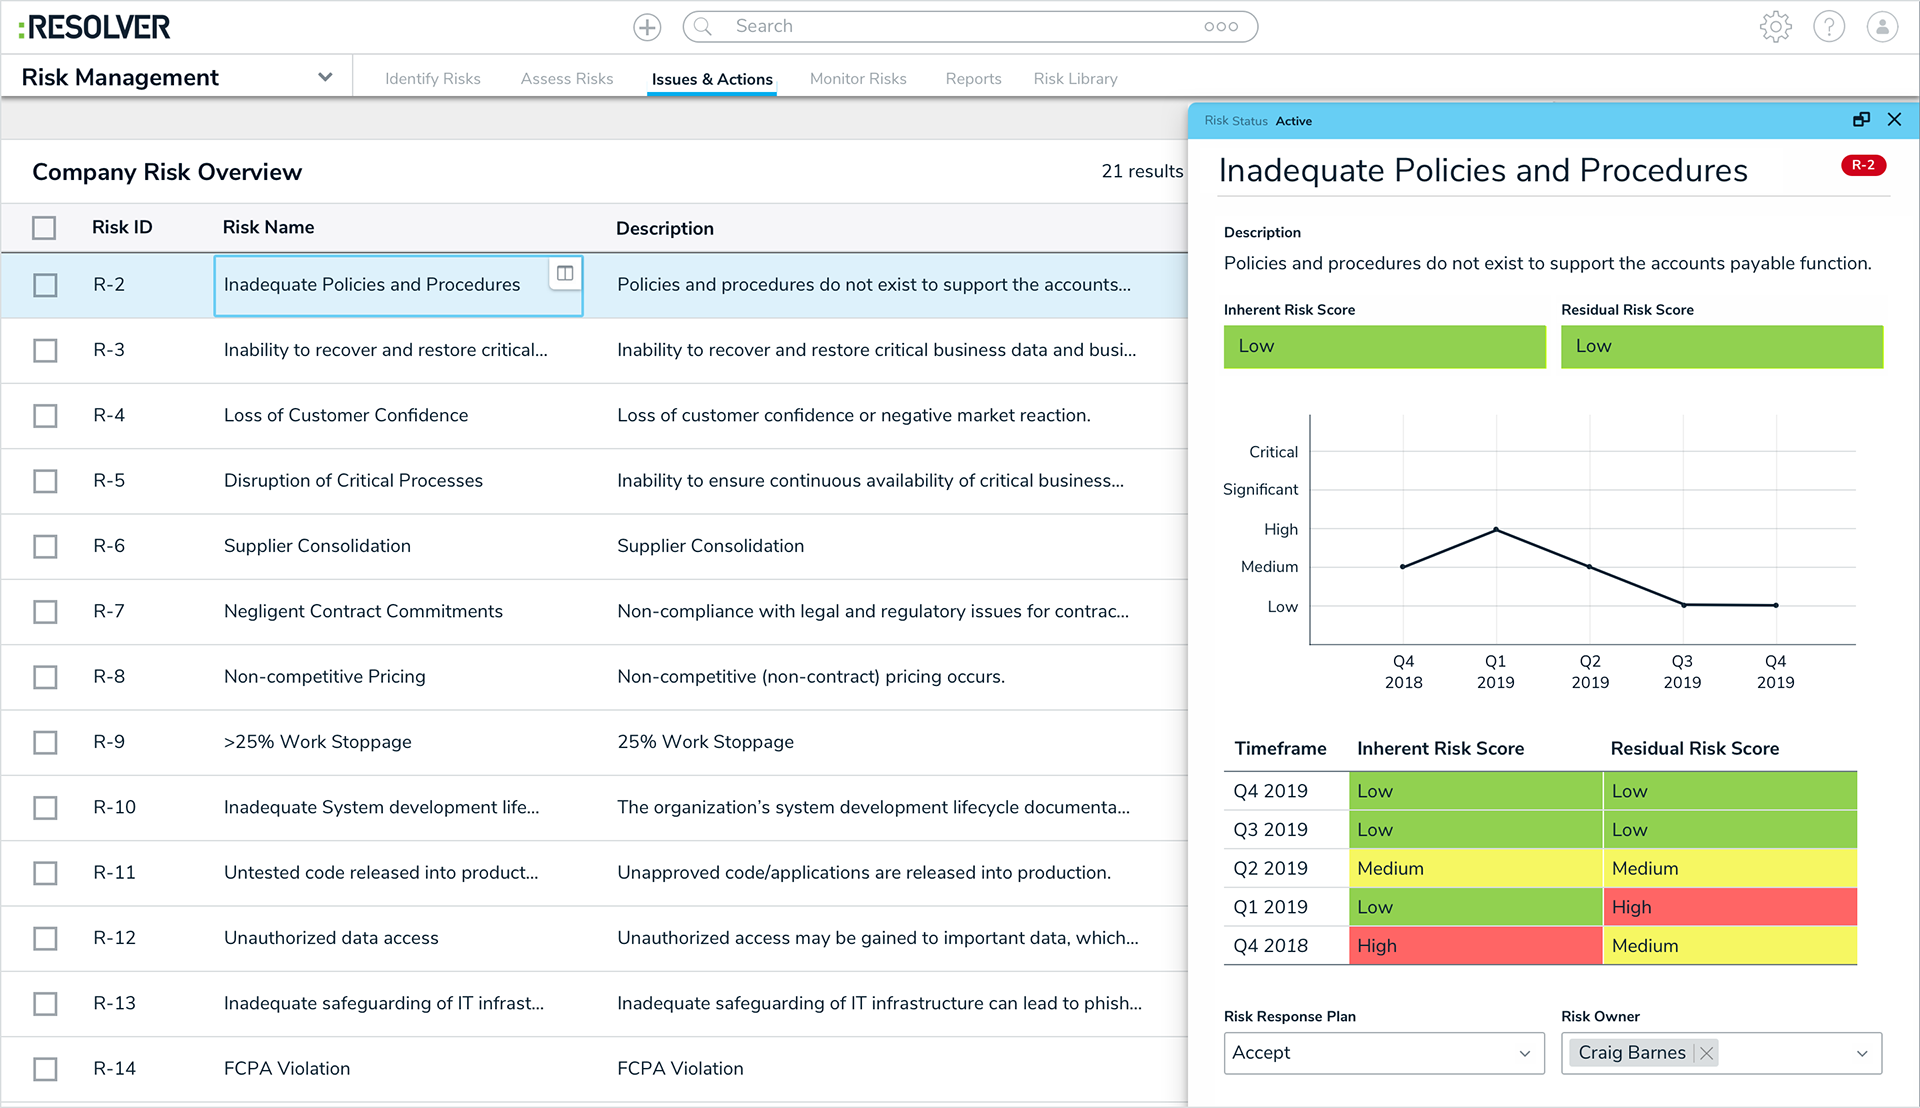
Side panel showing more detailed analysis of a selected risk
Next Steps
The DataGrid is now a heavily used feature in Resolver and we continue to iterate on it in order to meet our success criteria.